About halfway through my “The Power of Time” presentation, someone in the audience always raises their hand to ask.
“Today’s interest rates [on savings] are not even 1%. Why are you using a 11% [annual compound growth rate] in your examples?”
Everyone is thinking it. A few members of the audience even have their arms crossed as they prepare for me to start selling them something.
Most investors don’t achieve 11% per annum
The truth is that historically, most investors don’t achieve a rate of return anywhere near 11% per year over their entire investment life. It’s completely achieveable, but most focus and react on short-term performance of their investments and can’t get out of their own way (thus the reason for Fintelligence to begin with).
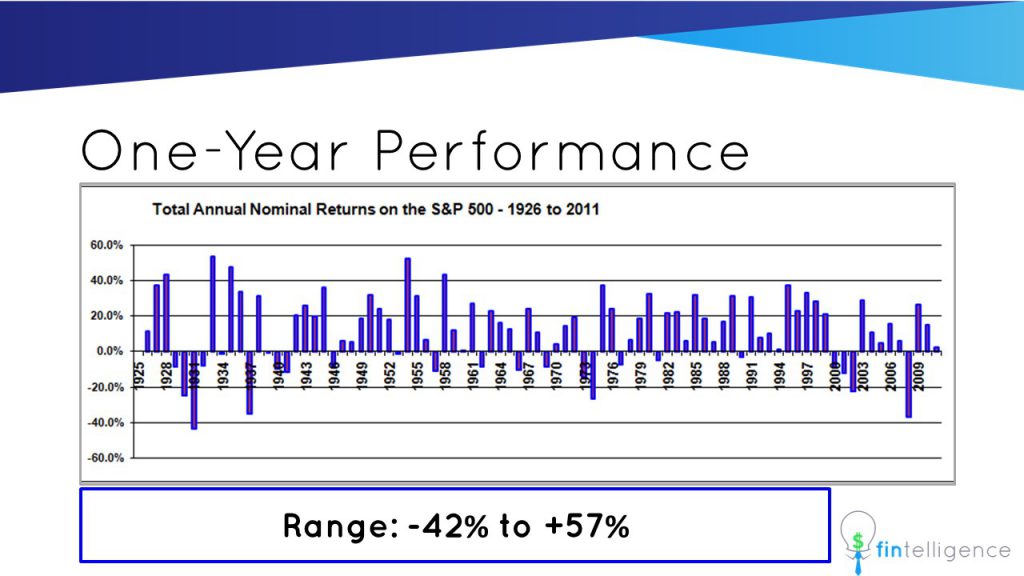
Over the last 100 years or so, the performance of the largest stock market in the world (USA) as measured by the S&P 500 index (a representative basket of 500 of the largest company stocks in the US) has provided returns ranging from -42% to +57%.

Volatility is NOT Risk
Many investors see the volatility in this chart and decide there’s too much risk in the stock market and avoid investing in stocks altogether. Others believe they can hire experts (e.g., mutual fund managers and financial advisors) who can effectively time the market by buying before the rise and selling before the fall.
It makes little sense to look at the (arbitrary) performance of the market over a one-year window when we’re investing over a 50+ year horizon. To the extent possible, let’s examine what happens as we widen our investment window.
The chart below shows the 10-year rolling returns of the US stock market going back to the 1930’s – this means it covers every 10-year period for the US stock market going back to a start date of around the mid-1920.
Here, the fluctuations are less severe than the one-year chart. It turns out that the expected annualized compound return would have ranged from -6.1% to +21.5% over any ten-year period in recent history.
Expanding time horizon decreases variance of results
You would expect that further increasing the time horizon would also narrow the gap between the best and worst investment outcomes. This is indeed the case as indicated by the charts below representing rolling 20-year and 30-year investment periods.
Examining the range of possible outcomes in the above chart, you’ll note that an 11% per year compound rate of return is right in the middle of the range (+7.4% to +14.6%).
Of course, you could ask: “What if I’m unlucky and invest all of my money on the worst possible day possible? Wouldn’t I just get a 7.4% rate of return?” The answer is that no one really invests that way. For almost all of us (lottery winners excluded), we should be investing small amounts regularly (I suggest monthly) over a long time. Thus, you’re entering the market at pretty much every entry point shown in this chart.
Investing regularly mitigates market risk
That is, if you’re investing $300 every month over 30+ years, some of your $300 investments will grow at +7.4% compounded per year and others will grow at +14.6% compounded per year (and pretty much every other rate of return within the range).
Note the above assumes that you don’t compromise your return with emotional decisions along the way when impact of inevitable market crashes crush your expectations. This is why you have to have Conviction to be a successful investor.
Recent Comments